Utilisation of statistical approaches within the scope of lifetime prediction methods for notched specimens using the example of unalloyed steels
The construction of dynamically loaded metallic materials and components is usually based on the relation between the stress amplitude and the number of cycles to failure, which is displayed in S-N curves. For this reason, the generation of S-N curves, for which a minimum number of 20 tests is recommended according to DIN 50100:2022-12, is of great importance. Statistical statements regarding the probability of fracture or failure result in a significantly improved lifetime prediction, whereas the increased number of tests and the associated experimental effort lead to increased costs. A new lifetime prediction method (LPV) is being developed to bridge the gap between statistically verified lifetime predictions and the resulting increase in time and costs. The lifetime prediction method StressLife, which is characterized by S-N curves in the high cycle fatigue (HCF) range based on data from a small number of fatigue tests, serves as the basis for the new development method. The material reactions from just one load increase test and two constant amplitude tests are determined by using different NDT measurement procedures (e. g. optical strain measurement and electric resistance measurement) and used as an input variable for the LPV. The method to be developed contains fundamental extensions and unique selling points compared to existing methods with regard to two aspects. The first aspect is the systematic investigation and integration of statistical procedures, which makes it possible to estimate different fracture and failure probabilities. The second aspect includes the consideration of data from notched fatigue tests, which can provide notched S-N curves with reduced testing effort and thus provide an initial approach with regard to a component S-N curve.
The method development is carried out on the model material C45E, which is available in two different heat threatment states (annealed and tempered). Comprehensive fatigue tests are carried out using the StressLife method for process development with the steel C45E in two heat treatment conditions. Two different notched geometries are used, which differ in terms of their notch shape numbers. For the statistical analysis, the primary focus is on recording the scatter due to the small sample size in the LPV. Parametric and non-parametric test methods are used for the density estimation.
The aim of the proposed research project is to develop a lifetime prediction method that enables the most accurate prognosis possible with regard to cyclic deformation behaviour and (residual) fatigue life despite a reduced specimen effort. Since multiaxial stress states occur in the case of notched specimens under stress, this approach can also be transferred to demonstrator or component tests, thereby creating a wide field of application for future use.
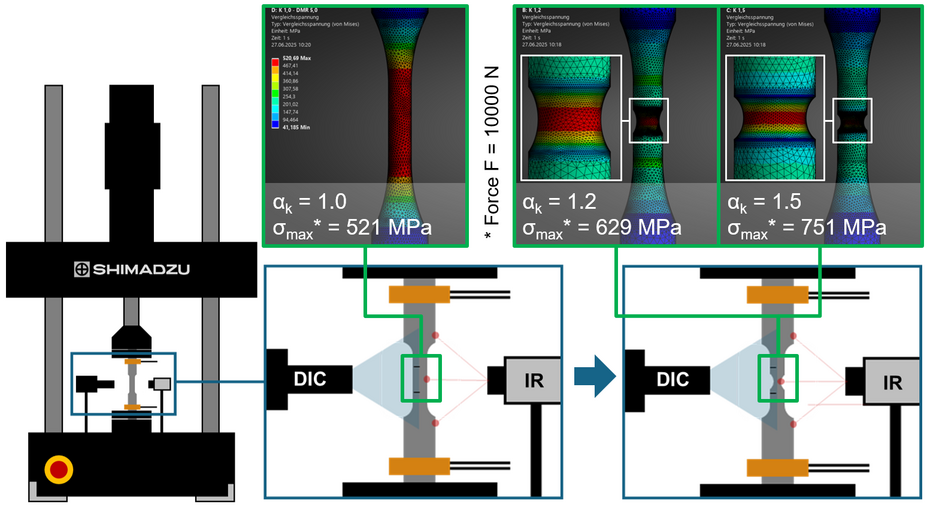
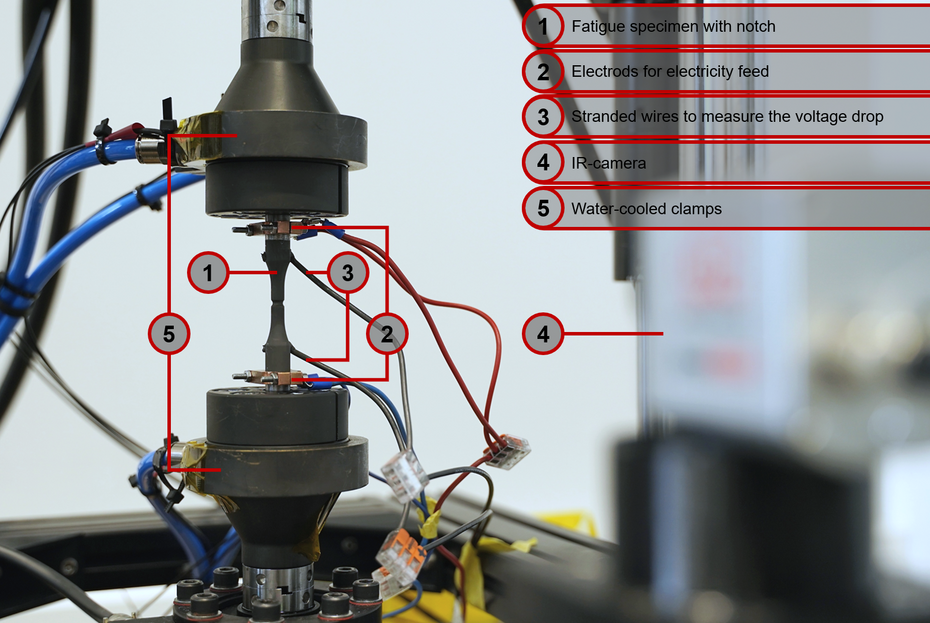
When testing notched fatique specimens, it`s necessary to adapt the non-destructive testing methods used during the test to the geomerty of the specimen. The maximum stress occurs in the notch root and depends directly on the size of the notch factor.
Initial results on the integration of statistical methods into accelerated lifetime prediction using the example of the material C45E were presented at the conference “Steel Innovation” in April 2025. The procedure for generating an S-N curve with density function, to describe the scatter band, is shown and described below.
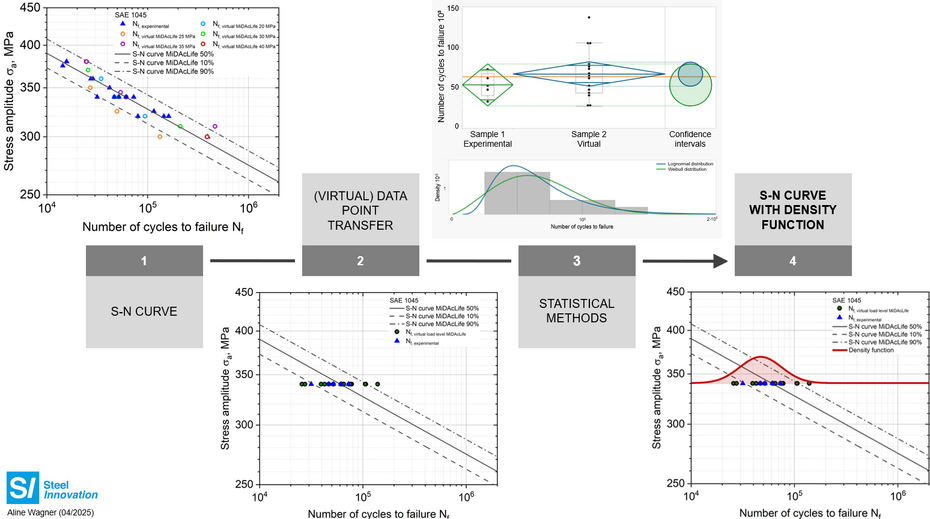
The S-N curve generated using accelerated lifetime prediction methods are based on only a few real data points due to the significantly reduced experimental effort. However, the database can be significantly expanded by generating virtual data points, which makes it possible to integrate statistical methods (Point 1).
In order to describe the scatter band of the lifetime prediction in the SN-curve using a density function as a function of the load horizon, a suitable load horizon must first be defined. All virtual data points are then projected onto this load horizon. It makes sense to select the load horizon that has the largest number of experimental data points (Point 2). Further information on this procedure can be found in the publication “F. Weber, A. Wagner, J. Koziol, F. Weber, C. Broeckmann, P. Starke, Consideration of Statistical Approaches Within the Accelerated Assessment of Fatigue Properties of Metallic Materials, Metals 15(2) (2025) 1-20.”.
To check whether the virtual and experimental data points originate from the same population, an variance analysis is carried out. If this is the case, both data sets can be used together to determine the best fitting distribution function and the corresponding density function (Point 3).
In the final step, the determined density function can be integrated into the SN-curve in relation to the selected load horizon (Point 4).

Wissenschaftliche Mitarbeiterin
- +49 631 3724-2051aline.wagner(at)hs-kl(dot)de
- Campus Kaiserslautern
- Room H 2.041.2

Assistent FB AING, Stellvertretende Fachgebietsleitung
- +49 631 3724-2259fabian.weber(at)hs-kl(dot)de
- Campus Kaiserslautern
- Room H1-2.010.3

Vizepräsident für Forschung und Transfer, Studiengangsleitung "Maschinenbau, Bachelor", Fachbereichsrat AING
- +49 631 3724-2389peter.starke(at)hs-kl(dot)de
- Campus Kaiserslautern
- Room H1-2010.1